
Ashley Cutler
Head of Product
Published on December 18, 2025 (10 months ago)
Introducing Usage Reports for Mux Video

New Usage Reports in the Mux Dashboard shows detailed breakdowns of your video usage across encoding, storage, and delivery over time.
Published on October 9, 2025 (about 1 year ago)
Keep your team on the same page: Introducing filter sets in Mux Data
Save and share filter combinations in Mux Data. Filter sets ensure your team monitors the exact metrics they need for any event or use case.
Published on July 8, 2025 (over 1 year ago)
The newest way to visualize Mux Data: Introducing Custom Dashboards
Create persistent, multi-metric dashboard views in Mux Data that remember your filters and configurations. Build once, return anytime to the exact video analytics setup you need.
Published on April 29, 2025 (over 1 year ago)
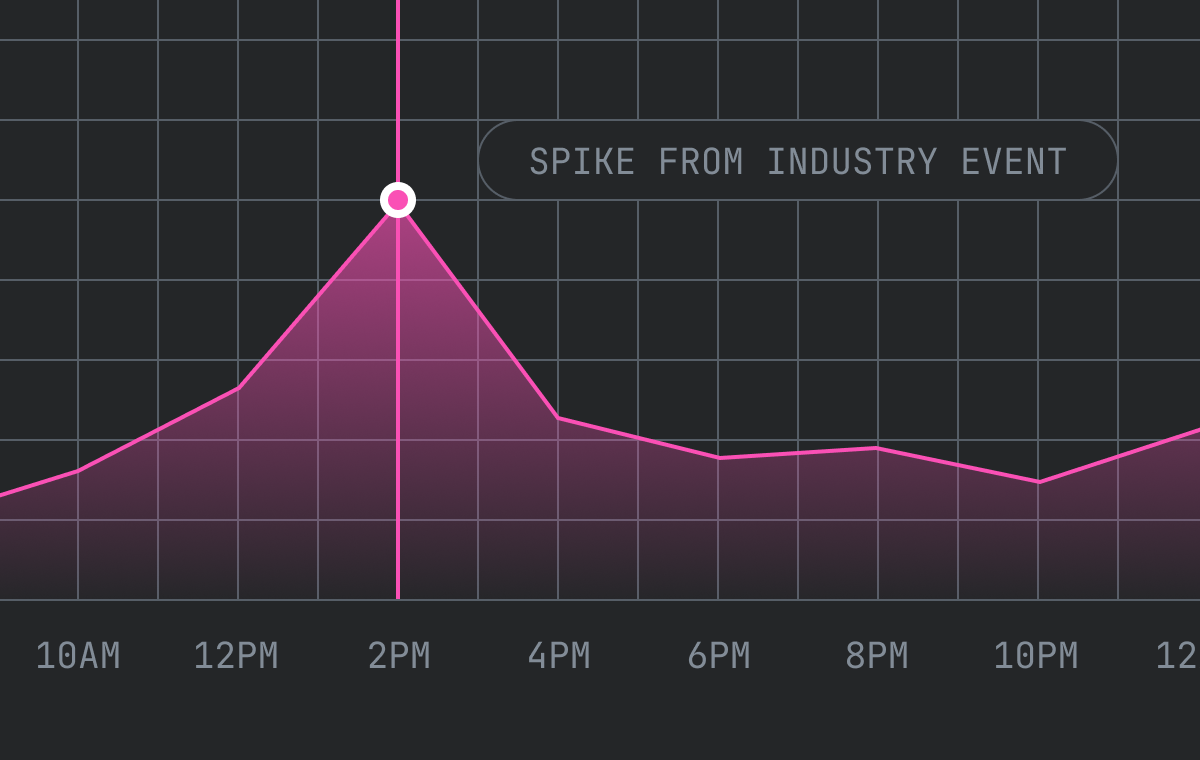
Highlight what matters: Introducing Annotations in Mux Data
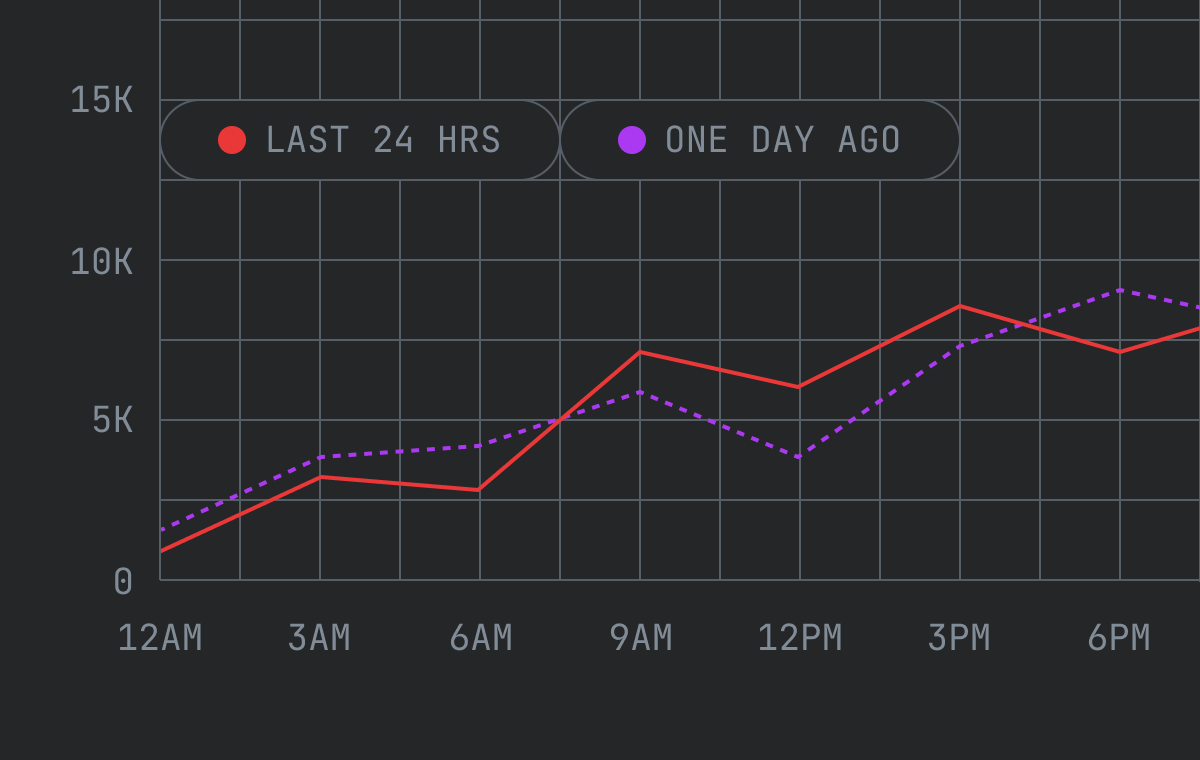
Add context to your video analytics with Annotations in Mux Data — add notes directly to timestamps in your dashboards for better team visibility and insights.
Published on December 12, 2024 (almost 2 years ago)
Understand your video trends: Introducing Mux Engagement
Introducing Mux Engagement - a new way to understand your video trends and top-performing content. Get insights into viewer engagement, retention, and more.